<<<
Chronological Index
>>> <<<
Thread Index
>>>
Re: [gnso-wpm-dt] WPM-DT: Step 3a (COMPLETED) -- Group DELPHI Results
- To: Ken Bour <ken.bour@xxxxxxxxxxx>
- Subject: Re: [gnso-wpm-dt] WPM-DT: Step 3a (COMPLETED) -- Group DELPHI Results
- From: Olga Cavalli <olgac@xxxxxxxxxxxxxxx>
- Date: Tue, 29 Dec 2009 12:02:07 -0300
Thanks Ken for all this work.
I also liked the blind voting as an improvement.
Happy new year to all!
Regards
Olga
2009/12/28 Ken Bour <ken.bour@xxxxxxxxxxx>
> WPM-DT Members:
>
>
>
> We had another successful call today, 28 December, with participation by
> Olga, Jaime, Chuck, Wolf and supported by Liz, Glen, Ken from Staff. This
> email will summarize *only* the technical results of the call in which
> Step 3a was completed. A second email will outline next steps and
> remaining issues that came out of today’s discussion.
>
>
>
> The call went about 105 minutes in total length (scheduled for 90 minutes);
> however, the time spent on ratings was approximately 70 minutes. In that
> time, we managed to settle on Resource Consumption (X axis) values for all
> 11 Projects (4 previously had DELPHI scores) or about 7 minutes each – very
> close to the previous session (21 December) in which Values/Benefits (Y
> axis) were rated.
>
>
>
> Please see my earlier email (Subject “Summary of Group Rating Session 21
> Dec 2009”) for a discussion of the methodology, which was similar this time
> with one minor exception. We turned off the Adobe Connect “Broadcast Poll
> Results” feature until after all participants had completed voting; then,
> the results were shared publicly. As the facilitator, I believe that
> change was a slight process improvement in that participants would not wait
> to see how others might vote before registering their own rating. Even
> with blind voting, there was a great deal of consensus after just one round
> of discussion/polling. In addition, the team decided that, as long as the
> Rating Range (High-Low score) was less than or equal to 2, the median result
> would be computed and accepted. If the Rating Range > 2, then another
> round would be attempted. For only one Project (RAA) did the group require
> a second DELPHI discussion period and polling before achieving sufficient
> commonality.
>
>
>
> The matrix below shows the results of the team’s efforts: black numbers
> are the DELPHI results based upon group discussion while green/orange were
> pre-decided based upon commonality of the Individual ratings.
>
>
>
> *X VALUES = RESOURCE CONSUMPTION*
>
> *SEQ NO*
>
> *SVG*
>
> *WUK*
>
> *CG*
>
> *JW*
>
> *OC*
>
> *LG*
>
> *DELPHI*
>
> STI
>
> 7
>
> 5
>
> 1
>
> 6
>
> 2
>
> 7
>
> *2.0*
>
> IDNF
>
> 3
>
> 4
>
> 3
>
> 3
>
> 4
>
> 3
>
> *3.0*
>
> GEO
>
> 3
>
> 2
>
> 1
>
> 4
>
> 1
>
> 2
>
> *1.0*
>
> TRAV
>
> 4
>
> 2
>
> 2
>
> 4
>
> 1
>
> 1
>
> *2.0*
>
> PED
>
> 5
>
> 4
>
> 3
>
> 5
>
> 4
>
> 5
>
> *4.5*
>
> ABUS
>
> 5
>
> 5
>
> 5
>
> 5
>
> 4
>
> 5
>
> *5.0*
>
> JIG
>
> 6
>
> 4
>
> 2
>
> 5
>
> 3
>
> 3
>
> *3.0*
>
> PDP
>
> 5
>
> 5
>
> 5
>
> 6
>
> 5
>
> 7
>
> *5.0*
>
> WG
>
> 5
>
> 2
>
> 3
>
> 5
>
> 4
>
> 5
>
> *4.0*
>
> GCOT
>
> 5
>
> 2
>
> 3
>
> 5
>
> 3
>
> 5
>
> *4.0*
>
> CSG
>
> 5
>
> 3
>
> 4
>
> 5
>
> 5
>
> 7
>
> *5.0*
>
> CCT
>
> 5
>
> 3
>
> 2
>
> 6
>
> 3
>
> 4
>
> *3.0*
>
> IRTB
>
> 5
>
> 4
>
> 2
>
> 4
>
> 3
>
> 5
>
> *4.0*
>
> RAA
>
> 6
>
> 5
>
> 3
>
> 6
>
> 4
>
> 7
>
> *5.0*
>
> IRD
>
> 2
>
> 3
>
> 3
>
> 3
>
> 3
>
> 6
>
> *4.0*
>
>
>
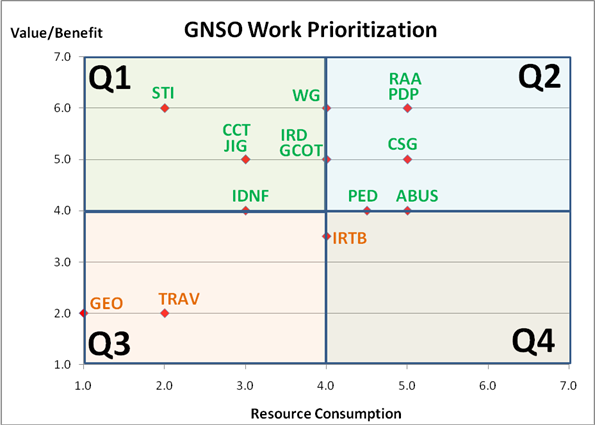
> Now that we have both X and Y values completed using the DELPHI approach,
> the chart below depicts the new plotting of the 15 Projects:
>
>
>
>
>
> *Note 1: CCT/JIG (3.0, 5.0); IRD/GCOT (4.0, 5.0); and RAA/PDP (5.0, 6.0)
> share common X,Y coordinates. *
>
> *Note 2: The correlation statistic between X, Y from both DELPHI sessions
> is 52%. *
>
>
>
> The above chart can be compared to the two earlier versions (Means,
> Medians) that were based upon Individual ratings (see Summary Tab of the
> attached spreadsheet – now KBv2). Depending upon which comparison is made,
> Means vs. Medians, the DELPHI results are relatively close with one or two
> exceptions: STI moved from Q2 to Q1 and IDNF went from Q3 to Q1 (although
> it is on the border). While the spread of the plotted points is wider in
> the DELPHI results (esp. compared to the Individual Means), there were very
> few substantive changes in positioning – just some jockeying around within
> the quadrants. We continue not to have a project evaluated in Quadrant 4
> (High Consumption and Low Value).
>
> With these results, Step 3a has been completed as originally outlined.
> Furthermore, Step 4 is now done, which was written as: “Develop the
> results matrix/chart based on the rankings/ratings produced in Step 3.”
> After
> today’s work, the team agreed to proceed on to Step 5, “Team assessment of
> the construct and process/methodology and recommendations.” It is possible
> that, after our next meeting, a decision could be made to go back to Step 3
> and try another combination, that is, there is team member interest in
> attempting small groups of 2-3. If that is the final decision, we will
> repeat Steps 4 and 5 for that iteration before moving to Step 6 “Focus on
> HOW the team might utilize the data in terms of developing a prioritization
> -- the ultimate goal of this effort.”
>
>
>
> Another email will outline next steps as well as a few issues that were
> uncovered during today’s session that require additional team discussion and
> analysis.
>
>
>
> Ken Bour
>
>
>
>
>
>
>
>
>
>
>
--
Olga Cavalli, Dr. Ing.
www.south-ssig.com.ar
<<<
Chronological Index
>>> <<<
Thread Index
>>>
|