RE: [gnso-wpm-dt] WPM-DT: Step 3a (Rating Test #1 - In Progress)
- To: "Ken Bour" <ken.bour@xxxxxxxxxxx>, <gnso-wpm-dt@xxxxxxxxx>
- Subject: RE: [gnso-wpm-dt] WPM-DT: Step 3a (Rating Test #1 - In Progress)
- From: "Gomes, Chuck" <cgomes@xxxxxxxxxxxx>
- Date: Tue, 15 Dec 2009 19:11:32 -0500
Here are my ratings.
Chuck
________________________________
From: owner-gnso-wpm-dt@xxxxxxxxx [mailto:owner-gnso-wpm-dt@xxxxxxxxx]
On Behalf Of Ken Bour
Sent: Friday, December 11, 2009 4:21 PM
To: gnso-wpm-dt@xxxxxxxxx
Subject: [gnso-wpm-dt] WPM-DT: Step 3a (Rating Test #1 - In Progress)
Team Members:
As discussed in our last teleconference on 10 December (2000 UTC), we
agreed to begin our first testing exercise and to complete it on or before our
next session scheduled for 17 December (same time).
This first test involves each team member INDIVIDUALLY rating all 15
Projects using the following 7-point Likert scale.
Scale:
Interpretation:
1
Far Below
2
Moderately Below
3
Slightly Below
4
Average
5
Slightly Above
6
Moderately Above
7
Far Above
Scale Guideline:
A way to think about the scale's application, in this exercise, is as
follows:
Although you may begin rating projects on either dimension or both
simultaneously, for this purpose, I will start with Value/Benefit. As you look
at all 15 projects taken together (see Attachment: Consolidated GNSO
Projects...), which one (or more) represents your best perception of AVERAGE in
terms of Value/Benefit. For example, suppose that you happen to think that
Project "WG" is an AVERAGE project in terms of Value/Benefit compared to all
the others. Once you have "anchored" your perceptual scale in this way, then
it is a matter of deciding whether the other projects are Far Below, Moderately
Below, Slightly Below, Slightly Above, Moderately Above, or Far Above that
"average" project in terms of this dimension. This same process can be used,
of course, for Resource Consumption.
If you have trouble deciding on an AVERAGE project, consider anchoring
at either of the scale extremes, that is, determine which project you think is
FAR ABOVE or FAR BELOW all of the others in terms of Value/Benefit (or Resource
Consumption). There are no absolute or independent referents -- you are being
asked to rate these projects RELATIVE to each other.
Instructions:
Attached is an Excel Template (GNSO Project Prioritization Rating
Template) that you should use for rating each project on both the X and Y
dimensions. Directions are contained inside the template. Please enter your
Name in the space provided and the Date you complete the form. Please do not
forget to RESAVE it to another name as described inside the spreadsheet.
***Please note that all cells are LOCKED except those in which you will
enter your ratings***
All other spreadsheet cells are protected in order to simplify the data
aggregation step and to prevent accidental mistyping.
For your convenience, I have posted the latest approved definitions
below (including Stéphane's recent change).
Y - Value/Benefit ... this dimension relates to perceptions of overall
value and benefit to: 1) the global Internet community; and 2) ICANN
stakeholders. Components of this dimension may include, but are not limited
to: new opportunities for Internet growth/expansion, enhanced competitiveness,
resolution/improvement of serious performance or infrastructure problems,
increased security/stability, and improved user experience.
X - Resource Consumption ... this dimension relates to perceptions of
total human capital expenditure anticipated and includes such factors as
complexity (e.g. technical); intricacy (e.g. many moving parts to coordinate);
lack of cohesion (e.g. many competing interests); length of time/energy
expected; and availability/scarcity of resources including budgets/funding --
all of which contribute to the total resource consumption and overall cost
(economic and otherwise) required to develop a recommendation.
Expected Output:
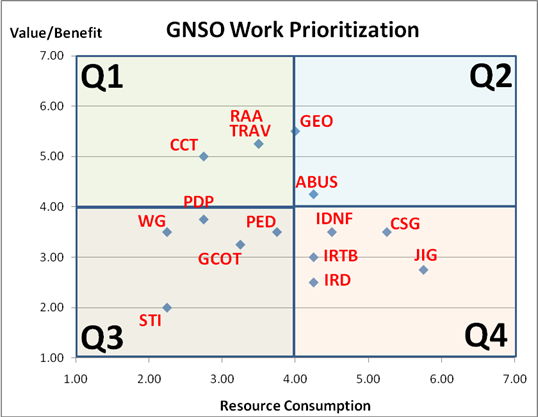
The outcome of this exercise, once we receive and process (e.g.
average) all of your individual ratings, will look something akin to the chart
below although the projects will be in different locations. To produce this
illustration, I assumed 4 raters and used a random number generator (1-7) for
each project on both dimensions - SO PLEASE - do not construe any meaning from
this diagram.
If you have questions about any of this material, I will keep an eye
out on the email list this weekend and am happy to be of assistance.
Good luck with this rating exercise!
Ken Bour
P.S. The consolidated GNSO Project List (attached) now shows WPM in
Table 2 per Stéphane's recommendation. I wrote a short description for it
which I hope is OK with the team.
Attachment:
GNSO Project Prioritization Rating Template - Gomes.xls
Description: GNSO Project Prioritization Rating Template - Gomes.xls
- References:
- [gnso-wpm-dt] WPM-DT: Step 3a (Rating Test #1 - In Progress)
- From: Ken Bour
- [gnso-wpm-dt] WPM-DT: Step 3a (Rating Test #1 - In Progress)