<<<
Chronological Index
>>> <<<
Thread Index
>>>
Re: [gnso-wpm-dt] WPM-DT: Step 3a (In Progress) -- Analysis of 6 Test Ratings and Prep for DELPHI Session Tomorrow
- To: Ken Bour <ken.bour@xxxxxxxxxxx>
- Subject: Re: [gnso-wpm-dt] WPM-DT: Step 3a (In Progress) -- Analysis of 6 Test Ratings and Prep for DELPHI Session Tomorrow
- From: Olga Cavalli <olgac@xxxxxxxxxxxxxxx>
- Date: Wed, 16 Dec 2009 21:03:07 -0300
Ken,
this work is really impressive.
Looking forward to talking to you tomorrow.
best
Olga
2009/12/16 Ken Bour <ken.bour@xxxxxxxxxxx>
> WPM-DT Members:
>
>
>
> Attached is an Excel spreadsheet containing the Test Results and analysis
> based upon the 5 DT members and 1 Staff person who provided rating files as
> of today. Incidentally, the sixth rater is Liz Gasster. Following
> Jaime’s suggestion, I asked her if she would like to toss in another set of
> ratings and she agreed. Marika also provided a set of ratings; however,
> they were not included in this tabulation since she cannot participate in
> our call tomorrow.
>
>
>
> I have developed a mathematical process for identifying commonality in the
> results although, for tomorrow’s session, I will not be able to include any
> additional ratings other than what has been aggregated as of this evening.
> The hard part was to noodle through the options to see if I could come up
> with anything that would work – it fell into place rather nicely using two
> common statistics: Range and Standard Deviation (StdDev).
>
>
>
> There are a few things I’d like to report thus far and all are contained in
> the attached spreadsheet. Incidentally, the spreadsheet has two tabs:
> most of the detail and analysis are in the *Ratings* tab and the
> Graphs/Charts (#4 and #5 below) are in the *Summary* tab.
>
>
>
> 1) FYI – the 6 correlation statistics between X and Y for our test
> ratings are:
>
> Chuck 11%
>
> Jaime 25%
>
> Stephane 45%
>
> Wolf 51%
>
> Olga 52%
>
> Liz 87%
>
>
>
> The above stat may be something we’ll end up discussing tomorrow during the
> DELPHI discussions. Once again, the higher the correlation statistic, the
> more likely it was that a high rating for X was matched by a high rating for
> Y. In other words, for 3-4 of you, the more valuable a project was
> perceived to be, the higher was its perceived resource consumption.
> Alternatively, the more a project was perceived to consume lots of
> energy/resource/time, the more value you assigned to it.
>
>
>
> 2) For the X axis, there were only 4 projects whose ratings had a
> tight Range (Diff between High and Low = 1 or 2) and a StdDev < 1.0. For
> those elements, I am recommending that we accept the MEDIAN value (shown
> below) as our DELPHI answer. They are highlighted in GREEN (Range=1) and
> ORANGE (Range=2). All the others had too much deviation/variance and
> should be discussed by the entire group.
>
>
>
> *X VALUES*
>
> *SEQ NO*
>
> *SVG*
>
> *WUK*
>
> *CG*
>
> *JW*
>
> *OC*
>
> *LG*
>
> *DELPHI*
>
> 1
>
> 7
>
> 5
>
> 1
>
> 6
>
> 2
>
> 7
>
> 2
>
> 3
>
> 4
>
> 3
>
> 3
>
> 4
>
> 3
>
> *3.0*
>
> 3
>
> 3
>
> 2
>
> 1
>
> 4
>
> 1
>
> 2
>
> 4
>
> 4
>
> 2
>
> 2
>
> 4
>
> 1
>
> 1
>
> 5
>
> 5
>
> 4
>
> 3
>
> 5
>
> 4
>
> 5
>
> *4.5*
>
> 6
>
> 5
>
> 5
>
> 5
>
> 5
>
> 4
>
> 5
>
> *5.0*
>
> 7
>
> 6
>
> 4
>
> 2
>
> 5
>
> 3
>
> 3
>
> 8
>
> 5
>
> 5
>
> 5
>
> 6
>
> 5
>
> 7
>
> *5.0*
>
> 9
>
> 5
>
> 2
>
> 3
>
> 5
>
> 4
>
> 5
>
> 10
>
> 5
>
> 2
>
> 3
>
> 5
>
> 3
>
> 5
>
> 11
>
> 5
>
> 3
>
> 4
>
> 5
>
> 5
>
> 7
>
> 12
>
> 5
>
> 3
>
> 2
>
> 6
>
> 3
>
> 4
>
> 13
>
> 5
>
> 4
>
> 2
>
> 4
>
> 3
>
> 5
>
> 14
>
> 6
>
> 5
>
> 3
>
> 6
>
> 4
>
> 7
>
> 15
>
> 2
>
> 3
>
> 3
>
> 3
>
> 3
>
> 6
>
>
>
> 3) For the Y axis, there are 5 projects whose ratings produced a
> StdDev < 1.0 and they are highlighted as described above.
>
>
>
> *SEQ NO*
>
> *SVG*
>
> *WUK*
>
> *CG*
>
> *JW*
>
> *OC*
>
> *LG*
>
> *DELPHI*
>
> 1
>
> 7
>
> 6
>
> 6
>
> 6
>
> 5
>
> 6
>
> *6.0*
>
> 2
>
> 4
>
> 6
>
> 3
>
> 6
>
> 3
>
> 2
>
> 3
>
> 2
>
> 5
>
> 1
>
> 4
>
> 1
>
> 1
>
> 4
>
> 5
>
> 2
>
> 1
>
> 4
>
> 3
>
> 1
>
> 5
>
> 5
>
> 4
>
> 4
>
> 4
>
> 3
>
> 6
>
> 6
>
> 5
>
> 3
>
> 1
>
> 7
>
> 2
>
> 6
>
> 7
>
> 4
>
> 6
>
> 5
>
> 7
>
> 4
>
> 3
>
> 8
>
> 6
>
> 7
>
> 7
>
> 6
>
> 6
>
> 6
>
> *6.0*
>
> 9
>
> 6
>
> 4
>
> 7
>
> 6
>
> 6
>
> 5
>
> 10
>
> 6
>
> 4
>
> 5
>
> 5
>
> 4
>
> 5
>
> *5.0*
>
> 11
>
> 6
>
> 4
>
> 4
>
> 5
>
> 5
>
> 5
>
> *5.0*
>
> 12
>
> 6
>
> 3
>
> 5
>
> 6
>
> 4
>
> 5
>
> 13
>
> 4
>
> 3
>
> 4
>
> 3
>
> 3
>
> 5
>
> *3.5*
>
> 14
>
> 4
>
> 6
>
> 5
>
> 7
>
> 5
>
> 7
>
> 15
>
> 5
>
> 4
>
> 5
>
> 7
>
> 4
>
> 4
>
>
>
>
>
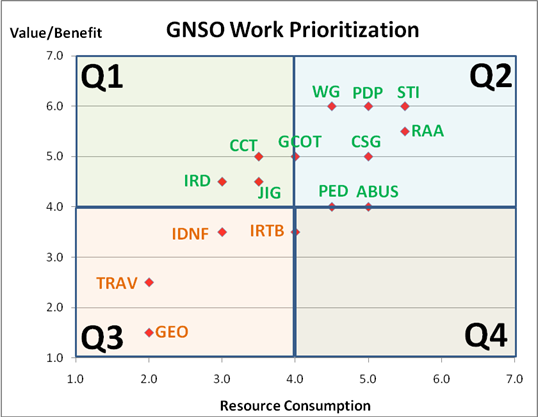
> 4) Using RAW Means (Averages), the following would be the Work
> Prioritization Chart given these six raters. Notice that there are no
> projects in Q4 (high cost, low value). The averaging process, as
> predicted, really does cause the numbers to cluster although, in this case,
> not so much at the Average (4, 4), but in the range 3-5 on X and 4-6 on Y.
> Nine or 60% of the projects are located in that tight area. Incidentally,
> I used GREEN letters above Y=4 and ORANGE below Y=4. Ties went to GREEN.
>
>
>
>
>
> 5) If I take the same ratings and use MEDIAN values (middle result)
> instead of MEANS, we get the following picture. You can see that the data
> spread is wider and less bunched compared to the above chart.
>
>
>
>
>
>
>
> I am still waiting for the information about our Adobe Connect room; but,
> as soon as I have it, you will be alerted. I think I have figured out how
> to upload the data that we will need tomorrow (same as above and
> attached).
>
>
>
> As for process, I suggest that we start with the first project for which
> there is not already a DELPHI answer (see above) and begin with the Y or X
> dimension – then work our way through them one at a time. After each round
> of discussion, I believe that I can do an internal POLL inside Adobe asking
> everyone to vote. I’m not sure how it will work and whether I will be able
> to see how each of you answered, but we’ll figure it out as we go along.
> Even if we use the Adobe Chat feature, we should be able to capture our
> individual ratings decisions as we progress. As we reach a DELPHI
> solution/answer, I will post it into my master spreadsheet and then produce
> new analyses and charts after we are finished with all of the projects.
>
>
>
>
> I will suggest this again tomorrow, but we should try our very best to work
> quickly and efficiently. We only skipped 9 elements (or 30%) by virtue of
> natural commonality in the existing ratings, which means that there will be
> 21 project/dimension combinations to discuss and, even if we move briskly,
> that is still a lot of ground to cover in one hour. That comes down to
> about *1 decision every 2 minutes* by the time we subtract the 5-10
> minutes on the front and back of every conference call needed for other
> business.
>
>
>
> At our next meeting after tomorrow’s session (TBD), we can either continue
> if we are not finished or use that time to step back, evaluate what we’ve
> done, decide what we liked, disliked, and then ask ourselves if there is
> anything else we would like to test.
>
>
>
> I hope this information is helpful. I look forward to our session
> tomorrow.
>
>
>
> Ken Bour
>
>
>
>
>
>
>
>
>
--
Olga Cavalli, Dr. Ing.
www.south-ssig.com.ar

<<<
Chronological Index
>>> <<<
Thread Index
>>>
|