<<<
Chronological Index
>>> <<<
Thread Index
>>>
RE: [gnso-wpm-dt] WPM-DT: Step 3a (COMPLETED) -- Group DELPHI Results
- To: "Ken Bour" <ken.bour@xxxxxxxxxxx>, <gnso-wpm-dt@xxxxxxxxx>
- Subject: RE: [gnso-wpm-dt] WPM-DT: Step 3a (COMPLETED) -- Group DELPHI Results
- From: "Gomes, Chuck" <cgomes@xxxxxxxxxxxx>
- Date: Mon, 28 Dec 2009 16:45:37 -0500
Well done Ken. Thanks.
I agree with you that the blind voting appeared to be an improvement.
Chuck
________________________________
From: owner-gnso-wpm-dt@xxxxxxxxx
[mailto:owner-gnso-wpm-dt@xxxxxxxxx] On Behalf Of Ken Bour
Sent: Monday, December 28, 2009 3:33 PM
To: gnso-wpm-dt@xxxxxxxxx
Subject: [gnso-wpm-dt] WPM-DT: Step 3a (COMPLETED) -- Group
DELPHI Results
WPM-DT Members:
We had another successful call today, 28 December, with
participation by Olga, Jaime, Chuck, Wolf and supported by Liz, Glen,
Ken from Staff. This email will summarize only the technical results
of the call in which Step 3a was completed. A second email will
outline next steps and remaining issues that came out of today's
discussion.
The call went about 105 minutes in total length (scheduled for
90 minutes); however, the time spent on ratings was approximately 70
minutes. In that time, we managed to settle on Resource Consumption (X
axis) values for all 11 Projects (4 previously had DELPHI scores) or
about 7 minutes each - very close to the previous session (21 December)
in which Values/Benefits (Y axis) were rated.
Please see my earlier email (Subject "Summary of Group Rating
Session 21 Dec 2009") for a discussion of the methodology, which was
similar this time with one minor exception. We turned off the Adobe
Connect "Broadcast Poll Results" feature until after all participants
had completed voting; then, the results were shared publicly. As the
facilitator, I believe that change was a slight process improvement in
that participants would not wait to see how others might vote before
registering their own rating. Even with blind voting, there was a
great deal of consensus after just one round of discussion/polling. In
addition, the team decided that, as long as the Rating Range (High-Low
score) was less than or equal to 2, the median result would be computed
and accepted. If the Rating Range > 2, then another round would be
attempted. For only one Project (RAA) did the group require a second
DELPHI discussion period and polling before achieving sufficient
commonality.
The matrix below shows the results of the team's efforts: black
numbers are the DELPHI results based upon group discussion while
green/orange were pre-decided based upon commonality of the Individual
ratings.
X VALUES = RESOURCE CONSUMPTION
SEQ NO
SVG
WUK
CG
JW
OC
LG
DELPHI
STI
7
5
1
6
2
7
2.0
IDNF
3
4
3
3
4
3
3.0
GEO
3
2
1
4
1
2
1.0
TRAV
4
2
2
4
1
1
2.0
PED
5
4
3
5
4
5
4.5
ABUS
5
5
5
5
4
5
5.0
JIG
6
4
2
5
3
3
3.0
PDP
5
5
5
6
5
7
5.0
WG
5
2
3
5
4
5
4.0
GCOT
5
2
3
5
3
5
4.0
CSG
5
3
4
5
5
7
5.0
CCT
5
3
2
6
3
4
3.0
IRTB
5
4
2
4
3
5
4.0
RAA
6
5
3
6
4
7
5.0
IRD
2
3
3
3
3
6
4.0
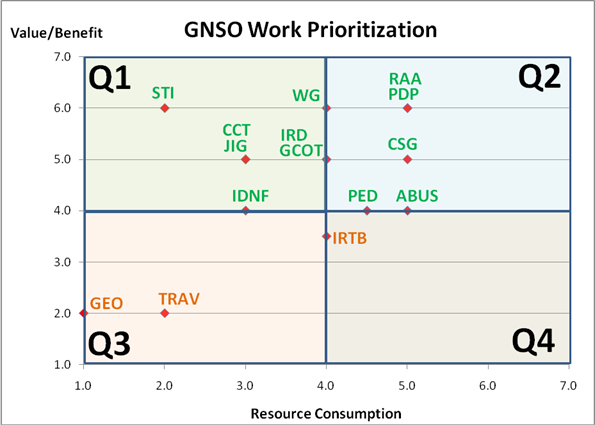
Now that we have both X and Y values completed using the DELPHI
approach, the chart below depicts the new plotting of the 15 Projects:
Note 1: CCT/JIG (3.0, 5.0); IRD/GCOT (4.0, 5.0); and RAA/PDP
(5.0, 6.0) share common X,Y coordinates.
Note 2: The correlation statistic between X, Y from both DELPHI
sessions is 52%.
The above chart can be compared to the two earlier versions
(Means, Medians) that were based upon Individual ratings (see Summary
Tab of the attached spreadsheet - now KBv2). Depending upon which
comparison is made, Means vs. Medians, the DELPHI results are relatively
close with one or two exceptions: STI moved from Q2 to Q1 and IDNF went
from Q3 to Q1 (although it is on the border). While the spread of the
plotted points is wider in the DELPHI results (esp. compared to the
Individual Means), there were very few substantive changes in
positioning - just some jockeying around within the quadrants. We
continue not to have a project evaluated in Quadrant 4 (High Consumption
and Low Value).
With these results, Step 3a has been completed as originally
outlined. Furthermore, Step 4 is now done, which was written as:
"Develop the results matrix/chart based on the rankings/ratings produced
in Step 3." After today's work, the team agreed to proceed on to Step
5, "Team assessment of the construct and process/methodology and
recommendations." It is possible that, after our next meeting, a
decision could be made to go back to Step 3 and try another combination,
that is, there is team member interest in attempting small groups of
2-3. If that is the final decision, we will repeat Steps 4 and 5 for
that iteration before moving to Step 6 "Focus on HOW the team might
utilize the data in terms of developing a prioritization -- the ultimate
goal of this effort."
Another email will outline next steps as well as a few issues
that were uncovered during today's session that require additional team
discussion and analysis.
Ken Bour
<<<
Chronological Index
>>> <<<
Thread Index
>>>
|