<<<
Chronological Index
>>> <<<
Thread Index
>>>
RE: [gnso-wpm-dt] WPM: Preliminary Thoughts in Preparation for Step 6
- To: "Ken Bour" <ken.bour@xxxxxxxxxxx>, <gnso-wpm-dt@xxxxxxxxx>
- Subject: RE: [gnso-wpm-dt] WPM: Preliminary Thoughts in Preparation for Step 6
- From: "Gomes, Chuck" <cgomes@xxxxxxxxxxxx>
- Date: Sun, 31 Jan 2010 10:01:07 -0500
Note that we have a new task to add to our project list: Vertical Integration
PDP (VER PDP?)
Chuck
________________________________
From: owner-gnso-wpm-dt@xxxxxxxxx [mailto:owner-gnso-wpm-dt@xxxxxxxxx]
On Behalf Of Ken Bour
Sent: Friday, January 29, 2010 7:18 PM
To: gnso-wpm-dt@xxxxxxxxx
Subject: [gnso-wpm-dt] WPM: Preliminary Thoughts in Preparation for
Step 6
WPM Team Members:
In preparation for next Tuesday's session (2 Feb 2010; 1700 UTC) in
which we are scheduled to discuss Step 6--Developing a Project Prioritization,
I have been thinking about this topic for several days and working through
various analyses of the model data generated thus far. While I do not have
specific recommendations to offer the team, a few principles and questions are
beginning to take shape. I thought I would share some of this thinking ahead
of time for those who have time to review and consider how the team can apply
what has been accomplished to date toward the ultimate objective.
NOTE: I apologize in advance that this material is dense in places.
Please do not attempt to digest it when you are stressed, preoccupied, and/or
multi-tasking which, I know, is the normal condition for ICANN volunteers and
Staff alike. J
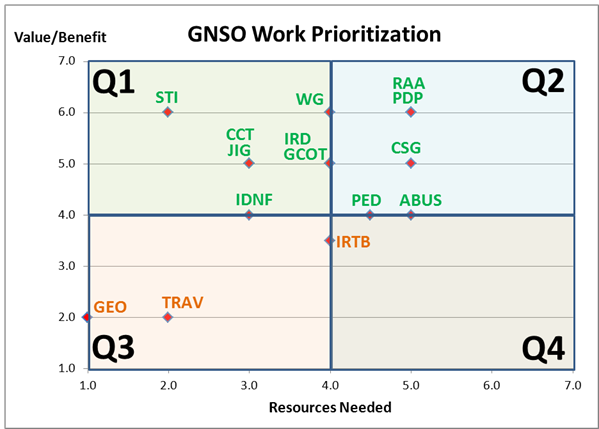
As we discussed briefly on our call last Tuesday, the process of
converting from the two-dimensional matrix/chart to a one-dimensional
prioritization is not necessarily straightforward. To see why, let's start
with a current picture of the DELPHI project placements on our 7-point scale
chart.
Accepting our definitions for X and Y and without making any
unwarranted assumptions, one set of interpretations from the four quadrants is
as follows (ignore the red dashed line for the moment):
Q1 = High Value, Low Resources à Inarguably, these projects should
have the highest priority to commence or proceed.
Q4 = Low Value, High Resources à Similarly, these projects are
obvious candidates to be stopped, slowed down, or postponed. [Note: As can be
observed from the chart, the team's test ratings did not produce any clear Q4
cases. At the risk of "retrogressing" on a point (following Jaime's insightful
lead), if high cross-correlation occurs between Resources Needed and
Value/Benefit, it is easy to predict that Q4 will be unpopulated. If that
result can always be expected, it begs the question whether this model is the
correct one for a project prioritization task. Normally, X and Y must be
INDEPENDENT variables in order to make a 4-Quadrant model work as theoretically
designed].
Q2 = High Value, High Resources à On the surface (arithmetically),
these projects are no more important in terms of priority than those in Q3 as
long as the numerical scale (1-7) is essentially the same between Value and
Resources. [Note: if that conclusion is not immediately obvious, I will shed
more light on it further into this discussion].
Q3 = Low Value, Low Resources à (the converse of Q2)
We are left, then, with two quadrants that produce relatively clear
action-strategies and two buckets in which the results are ambiguous. How
might we resolve the Q2/Q3 issue?
One straightforward approach is to take the rating results for
Value/Benefit and multiply them by Resources Needed and then sort by those
products. A project that is rated 7 on Value/Benefit and 7 on Resources Needed
(i.e. not needed) is the maximum result (7 * 7 = 49) we could achieve with this
scaling. First, we must recognize that "Far Below Average" Resources Needed is
a positive result, but we assigned it the value of 1 (lowest on the scale) for
convenience. In order to make the math work properly, we have to reverse all
of the X values by subtracting them from 8. So, TRAV is rated Y=2, X=2 on the
chart, but Resources Needed would actually count as a 6 if we had reversed the
scale when rating originally. To save everyone the arithmetic exercise, the
table below shows the conversions.
X Scale
Far Below
Moderately Below
Slightly Below
Average
Slightly Above
Moderately Above
Far Above
Original
1
2
3
4
5
6
7
Reversed
7
6
5
4
3
2
1
If we take all of the project DELPHI scores for Y and X (converted) and
multiply them together we get the following ranking:
Project
Resources
Value
R-Converted
(R-C)*V
Rank
STI
2.0
6.0
6.0
36.0
1
JIG
3.0
5.0
5.0
25.0
2
CCT
3.0
5.0
5.0
25.0
2
WG
4.0
6.0
4.0
24.0
4
GCOT
4.0
5.0
4.0
20.0
5
IRD
4.0
5.0
4.0
20.0
5
IDNF
3.0
4.0
5.0
20.0
5
PDP
5.0
6.0
3.0
18.0
8
RAA
5.0
6.0
3.0
18.0
8
CSG
5.0
5.0
3.0
15.0
10
PED
4.5
4.0
3.5
14.0
11
GEO
1.0
2.0
7.0
14.0
11
IRTB
4.0
3.5
4.0
14.0
11
ABUS
5.0
4.0
3.0
12.0
14
TRAV
2.0
2.0
6.0
12.0
14
Note: The column labeled "R-Converted" contains the adjusted X values
by taking each original score and subtracting it from 8.
Toward the bottom of the list (Rank=11), notice that PED, GEO, and IRTB
all have the same score (14.0) even though they occupy very different spatial
locations on the chart (Q2 and Q3). Similarly, ABUS and TRAV (Rank=14) have
the same result while being in opposite quadrants. As mentioned earlier in the
narrative, this apparent anomaly occurs because of the scale equality between
Value/Benefit and Resources Needed. Since the same 1-7 point scale is used for
both dimensions (equally weighted), a 2 on Value/Benefit has the same effect as
a 2 on Resources Needed (after conversion). Given a single rating scale for
both dimensions, theoretically, we should be ambivalent in choosing between a
project that is Far Above Average on Value/Benefit (Rating=7) and one that is
Far Below Average on Resources Needed (Converted Rating=7). On the other hand,
some team members may perceive that a project with HIGH Value/Benefit is more
important than one having comparably LOW Resources Needed and, thus, would give
a higher priority to PED and ABUS even though GEO is actually tied with PED and
scores higher than ABUS! I will take up that question a bit further into the
analysis...
How might we remedy this ambivalence between Q2/Q3?
One way to resolve this problem is to consider a straight line that
starts at 1,1 and goes to 7,7 (see red dashed line in above chart). Any
project whose Value/Benefit is >= Resources Needed is considered in the ACCEPT
area and any project whose Value is < Resources is in the QUESTIONABLE region.
One interpretation is that projects in the QUESTIONABLE region, relatively
speaking, are consuming more resources than the value they are generating and
are candidates for being reevaluated. In terms of relative priority, those
points furthest from the red line are the least important projects. ABUS would
be the lowest ranked project using this approach.
Another possibility is to develop a weighting system for Value/Benefit
that is different from Resources Needed, that is, alter the scales to accord
more/less weight to Y than X. Incidentally, although it may seem to be an
obvious solution, multiplying either series by a constant number (e.g. 4 for Y
and 2 for X) will produce identical project rankings. Said another way, the
X/Y dimension weights cannot be simple multiples of each other. To illustrate
an approach that would produce a unique ranking, suppose (see table below) we
decided to use a Fibonacci series (remember the SCRUM discussion back in
mid-December?) for the Y weights (starting arbitrarily at 2) and a straight
linear weighting for X matching the original scale.
Y-Scale
Y-Weight
X-Scale
X-Weight
1
2
1
1
2
3
2
2
3
5
3
3
4
8
4
4
5
13
5
5
6
21
6
6
7
34
7
7
If we multiply these series together, it produces a prioritization
shown in the table below. The column labeled "V*C" contains the product of the
weighted results.
Project
Resources
Value
R-Converted
V-Wgt
R-Wgt
V*R
Rank
STI
2.0
6.0
6.0
21.0
6.0
126.0
1
WG
4.0
6.0
4.0
21.0
4.0
84.0
2
JIG
3.0
5.0
5.0
13.0
5.0
65.0
3
CCT
3.0
5.0
5.0
13.0
5.0
65.0
3
PDP
5.0
6.0
3.0
21.0
3.0
63.0
5
RAA
5.0
6.0
3.0
21.0
3.0
63.0
5
GCOT
4.0
5.0
4.0
13.0
4.0
52.0
7
IRD
4.0
5.0
4.0
13.0
4.0
52.0
7
IDNF
3.0
4.0
5.0
8.0
5.0
40.0
9
CSG
5.0
5.0
3.0
13.0
3.0
39.0
10
PED
4.5
4.0
3.5
8.0
3.0
24.0
11
ABUS
5.0
4.0
3.0
8.0
3.0
24.0
11
GEO
1.0
2.0
7.0
3.0
7.0
21.0
13
IRTB
4.0
3.5
4.0
5.0
4.0
20.0
14
TRAV
2.0
2.0
6.0
3.0
6.0
18.0
15
Using this method, TRAV is the lowest ranked project followed by IRTB,
GEO, and ABUS.
There are myriad possibilities for weightings that could be applied to
X and Y differently, but I will stop here since the first step would be to
develop a rationale for such treatment. Once a justification is produced as to
why Y should be weighted higher than X (or vice versa), it is much easier to
create a numbering scheme that supports it.
Another option, as suggested on last week's call, is to create a new
prioritization/ranking using the above information as INPUT. One could start
by ranking projects within quadrants, for example, Q1, then Q2/Q3
(challenging?!), and, finally Q4. If this is a viable option, a reasonable
question that might be asked is: Is it possible to rank all of the projects
from 1 to 15 (or n) without first exercising the X/Y modeling step? If the
answer is YES, then this entire process could be radically abridged. If NO,
then the X/Y modeling is a useful precursor to developing rankings within
quadrants. [Note: a process needs to be developed for generating the
individual quadrant rankings, e.g. group Delphi?]
At this stage, Staff is neither leaning toward nor recommending any
particular solution, only exploring options and posing questions that the team
may want to consider in its ensuing deliberations.
Additional questions that might be productive to discuss as Step 6
unfolds:
· In what specific ways will a prioritized list of projects
assist the Council?
· Should the prioritization result in an unambiguous ranking
from 1 to n (no ties) or can projects be grouped into one or more buckets?
· What decisions or outcomes does the team expect from
executing the rating/ranking/prioritization processes?
· How are new projects added to the list and incorporated into
the process in terms of evaluation/ranking?
· Since the rating process is relative, is it possible to slot
a new project into the matrix/chart without reevaluating all of the others at
the same time?
· How are changes to project status identified, recommended,
approved, and incorporated?
· What frequency should the WPM process be exercised (e.g.
monthly, semi-annually, annually) or, if ad hoc, what trigger events cause one
to be initiated?
Again, I apologize for the length and complexity of this email, but I
thought it might be helpful to document some of my ruminations prior to our
next session.
Regards,
Ken Bour

<<<
Chronological Index
>>> <<<
Thread Index
>>>
|